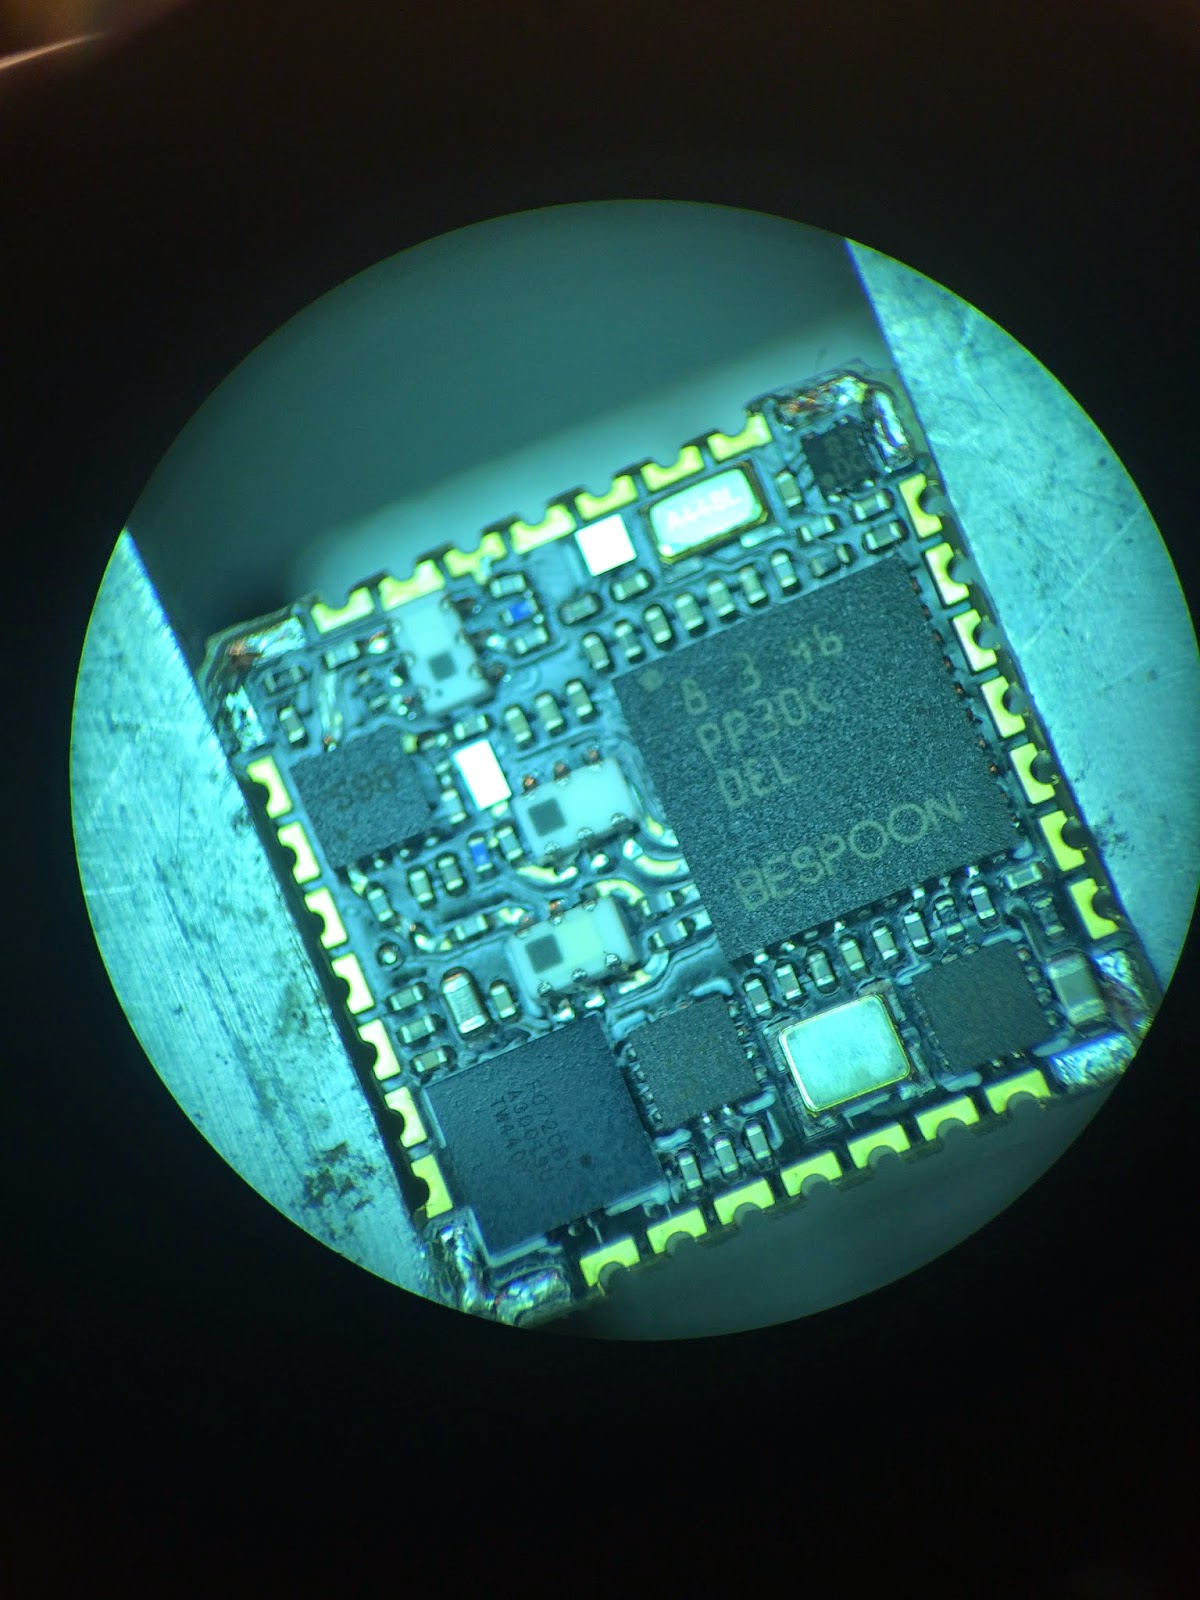
I spent today figuring out how to setup the development environment for the SpoonPhone.  It was pretty straightforward with a few funnies from BeSpoon, and there was a lot to learn.  For example, Eclipse is OUT, and Android Studio is IN.

As usual I wrote down the complete installation process in detail so there is some chance I can do it again.

Setting up Android Studio for the BeSpoon Android Phone

I couldn’t find any Android code that would import into Android studio, or Eclipse.

I wrote to BeSpoon, and got a “it all works” answer, which is less than I was hoping for.  Obviously I have to try and track down the cache of working code on the BeSpoon site.

———

So David and I see different things on the BeSpoon Forum Site.  Why is that?

David downloaded the latest stuff from the site.
Now I can load it into Android Studio, but I get this message:

Gradle ‘UWBLogger’ project refresh failed
Error:The project is using an unsupported version of Gradle.

Clearly you have to be a lot more clever than me to make this work.

So I swapped to Eclipse and was able to download UWBlogger, but it would not build either.

Errors occurred during the build.
Errors running builder ‘Android Pre Compiler’ on project ‘MainActivity’.
java.lang.NullPointerException

Typed ADL tracker into Google and got some interesting results.

It all has to be entered manually. There must be a huge market for a way to record ADL’s automatically. Care facilities and insurance companies would be interested, wouldn’t you think?
There will be a care nurse shortage:
A way to record ADL’s accurately would free up nurses for more critical care.

BeSpoon Range Test

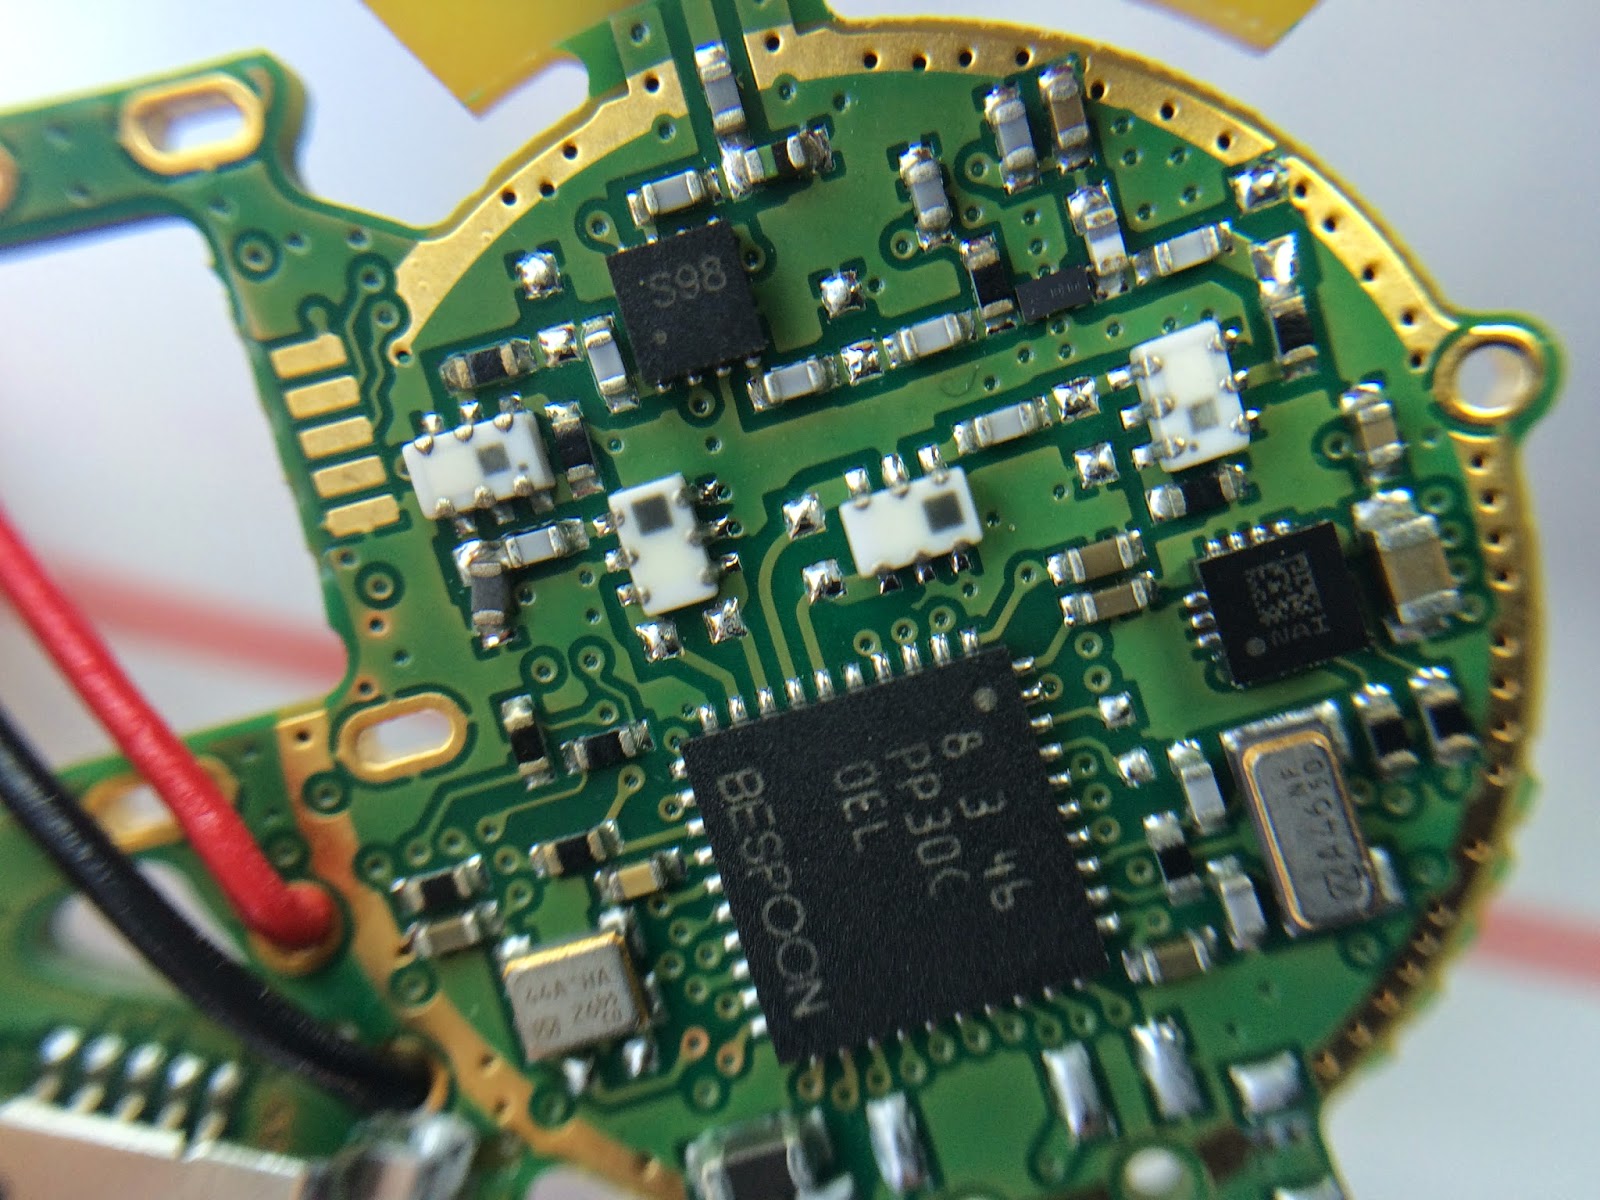
First a correction.  I don’t think the tag has anything else beyond the radio and a processor. I think all the other data is being provided by the phone.  First I noticed that there was a field in the data that I dan’t noticed earlier “gps” that seems to have lat/long values.   Then I noticed that the moving the tag was not changing the recorded accelerometer data.

I did a simple range test of the kind David suggested in a recent email.  The results look pretty good, compared with the kind of results I got from the Nanotron.

Procedure

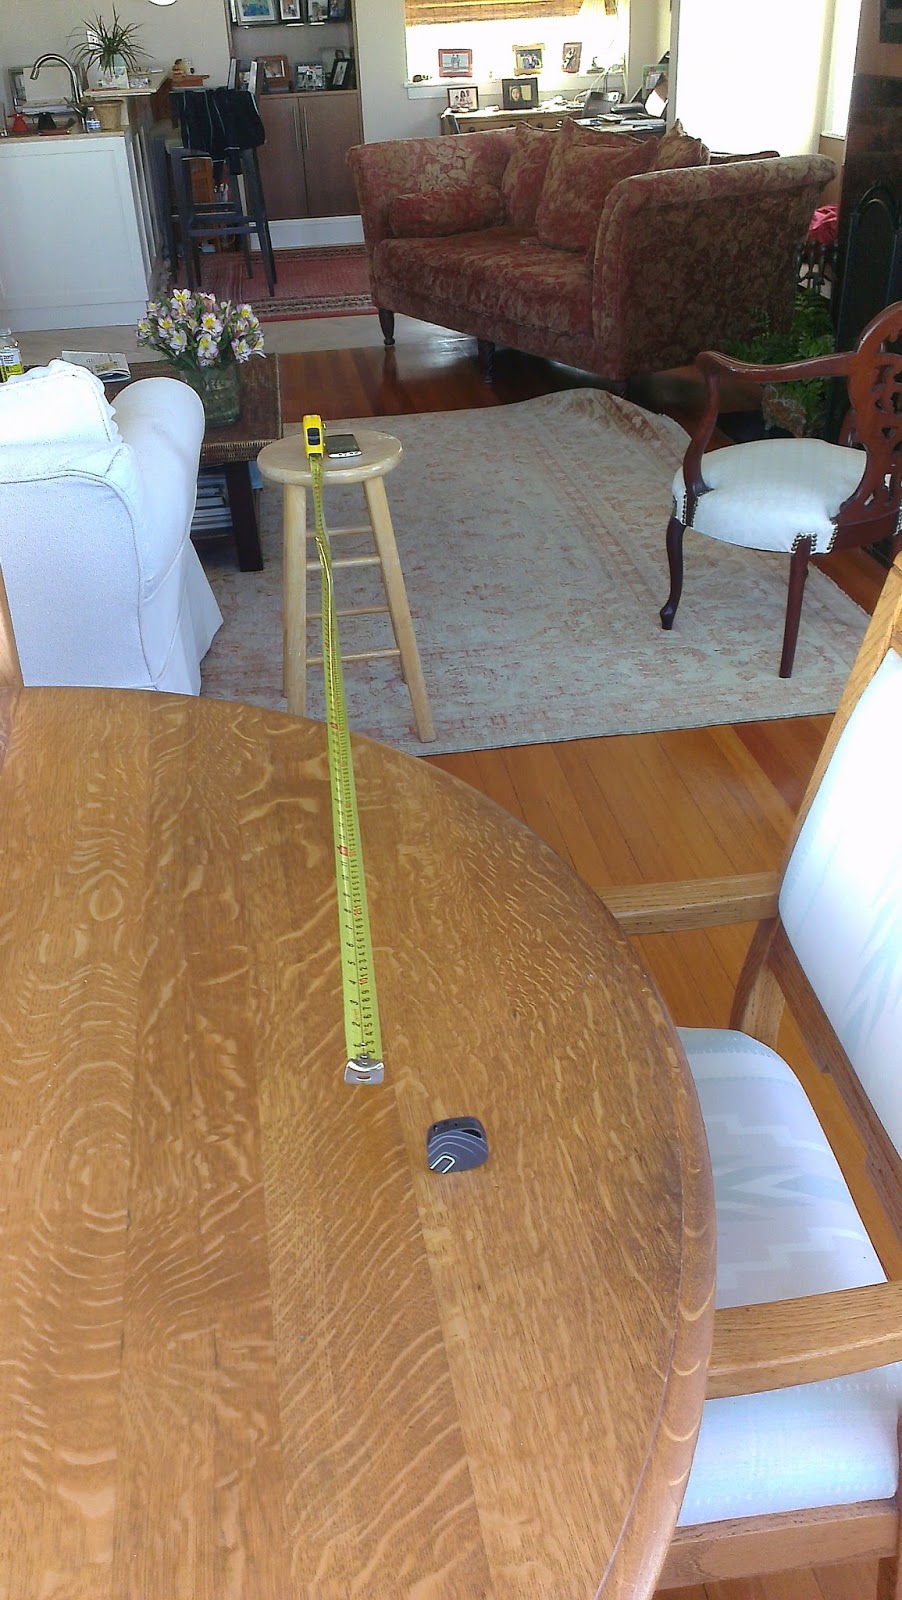
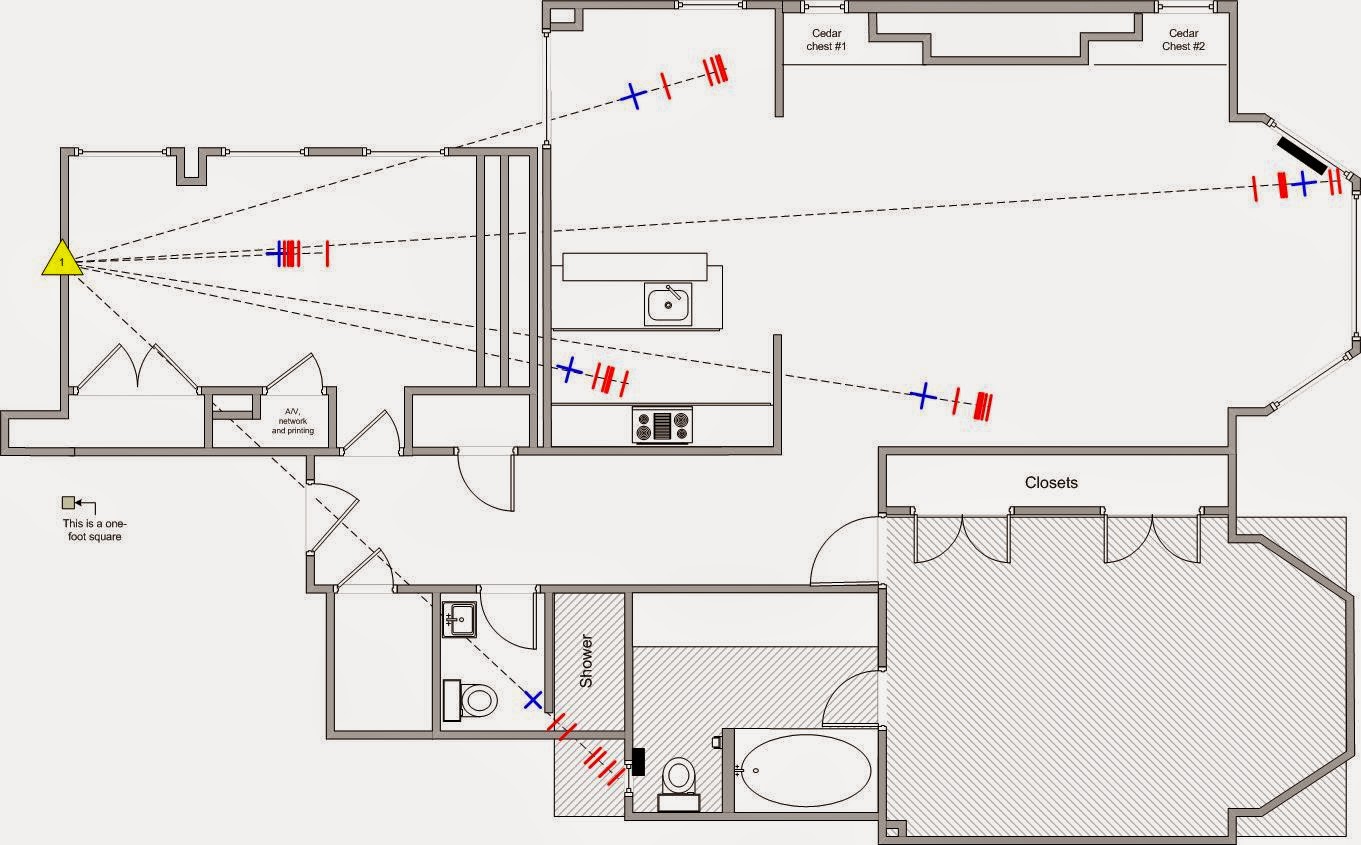
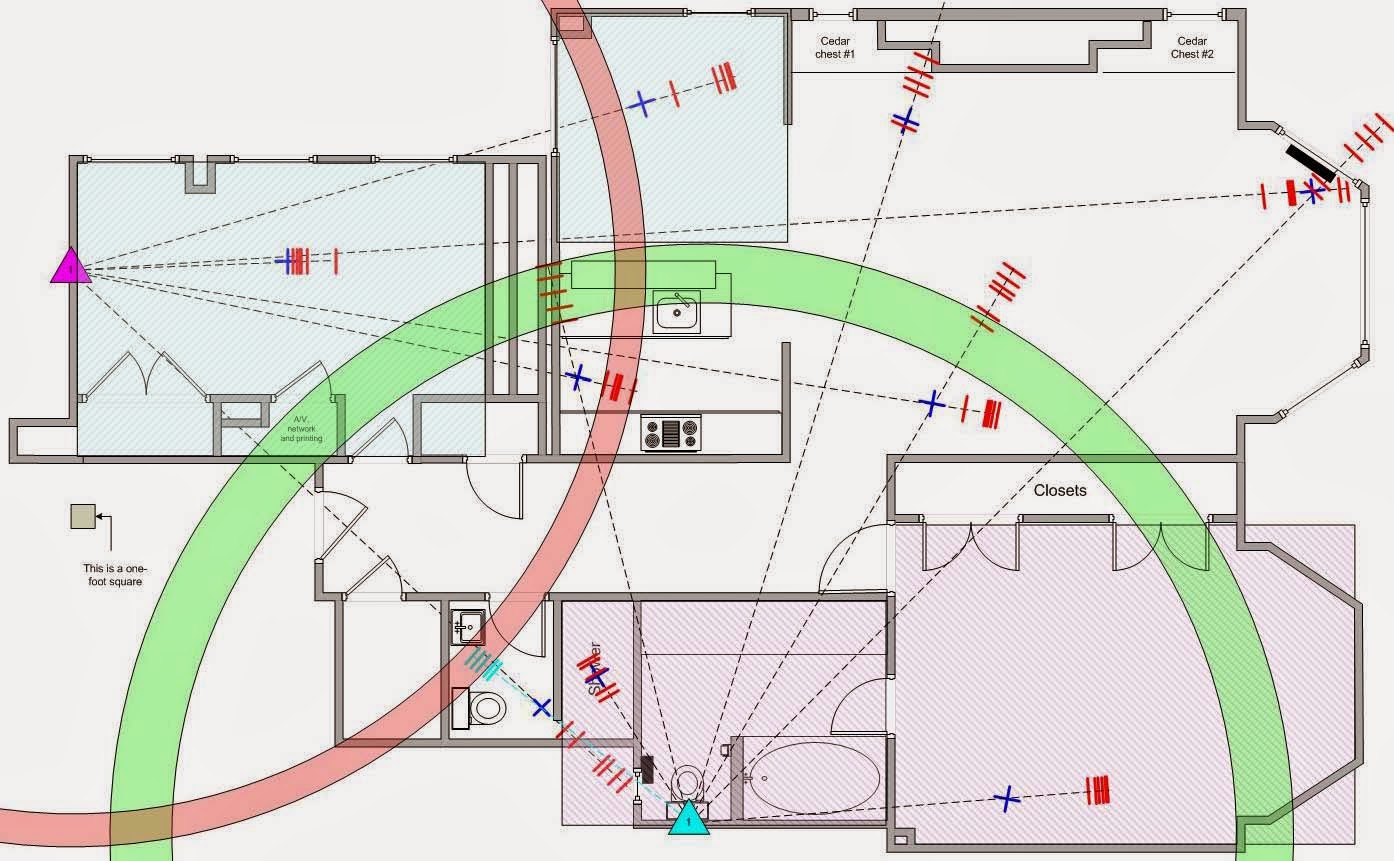
I used the same sort of procedure that I used for measuring the Nanotron.   Basically I set sender and receiver on a wooden surface and then stepped off in one meter increments.
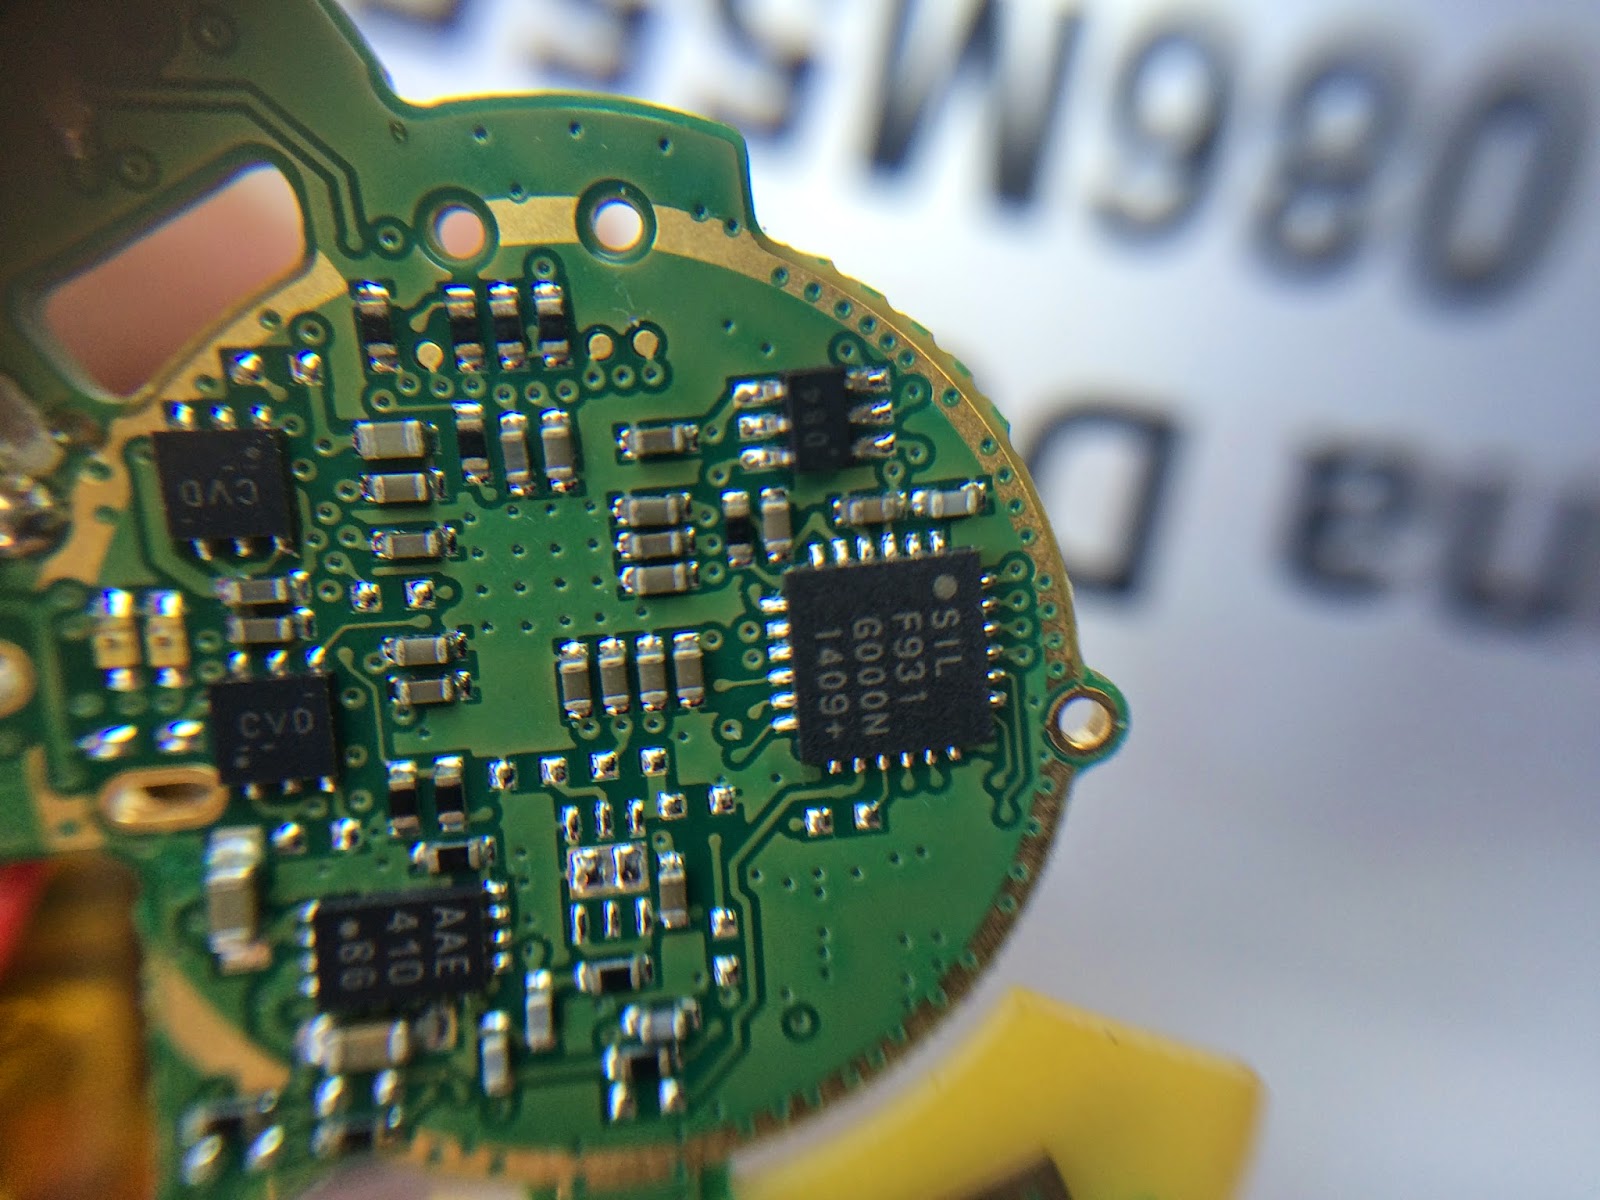
I used a lsightly different arrangement that what’s shown in this photo becuase I didn’t want to steel ruler to nterfere with the signal too much.
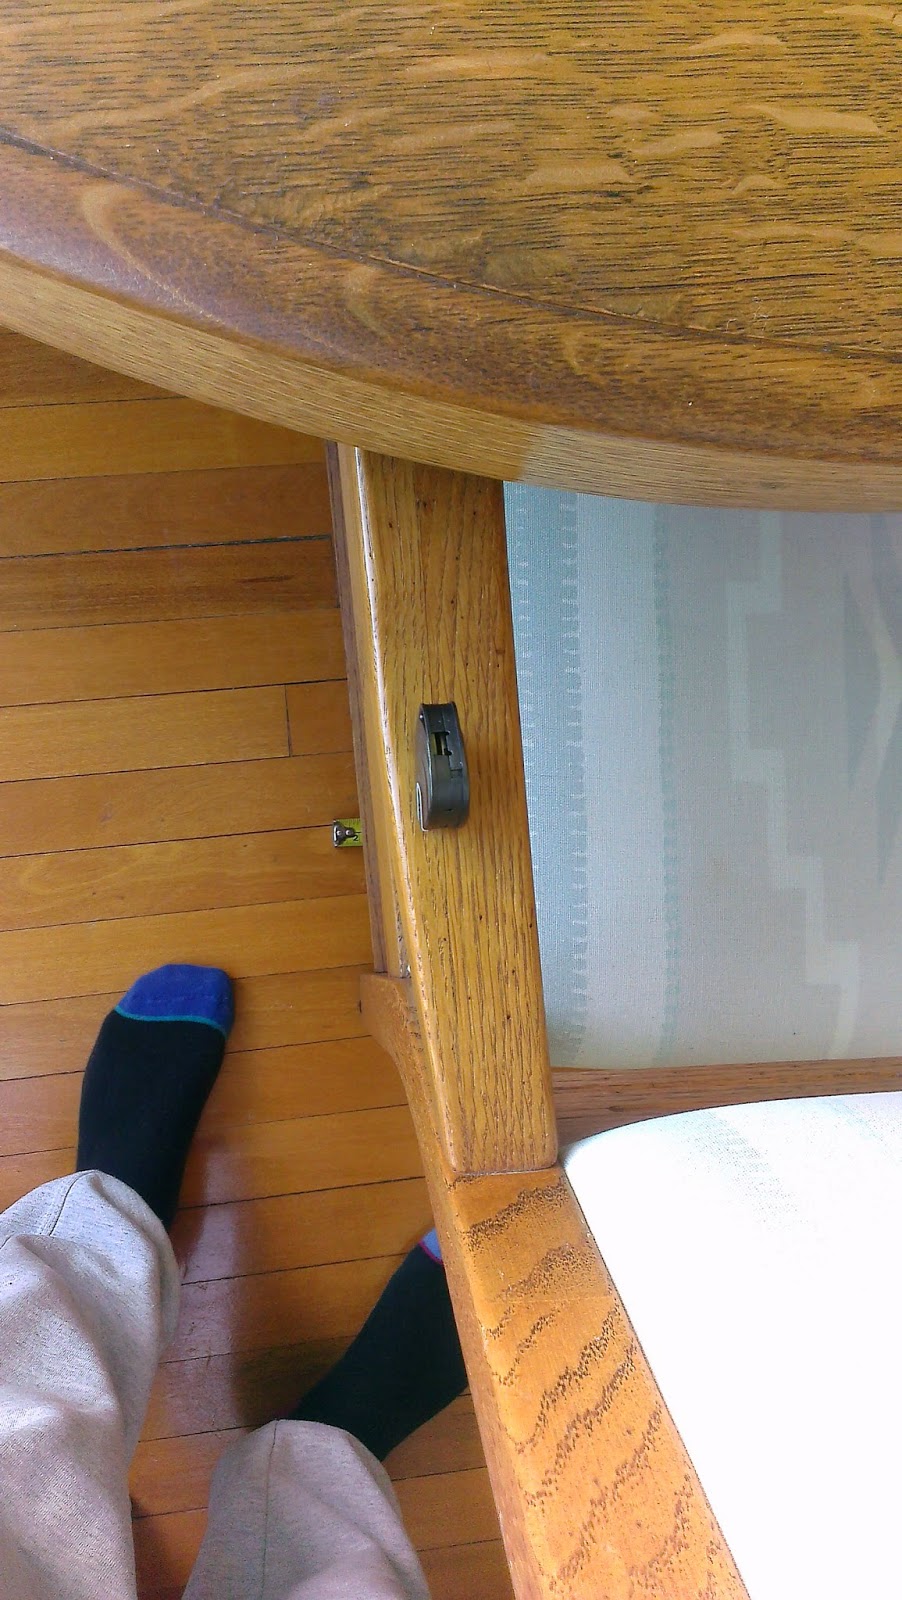
I put a tag on the arm of a wooden dining chain near the bay window.  I measured off meters across the room until I ran out of space.  (8 meters).
 
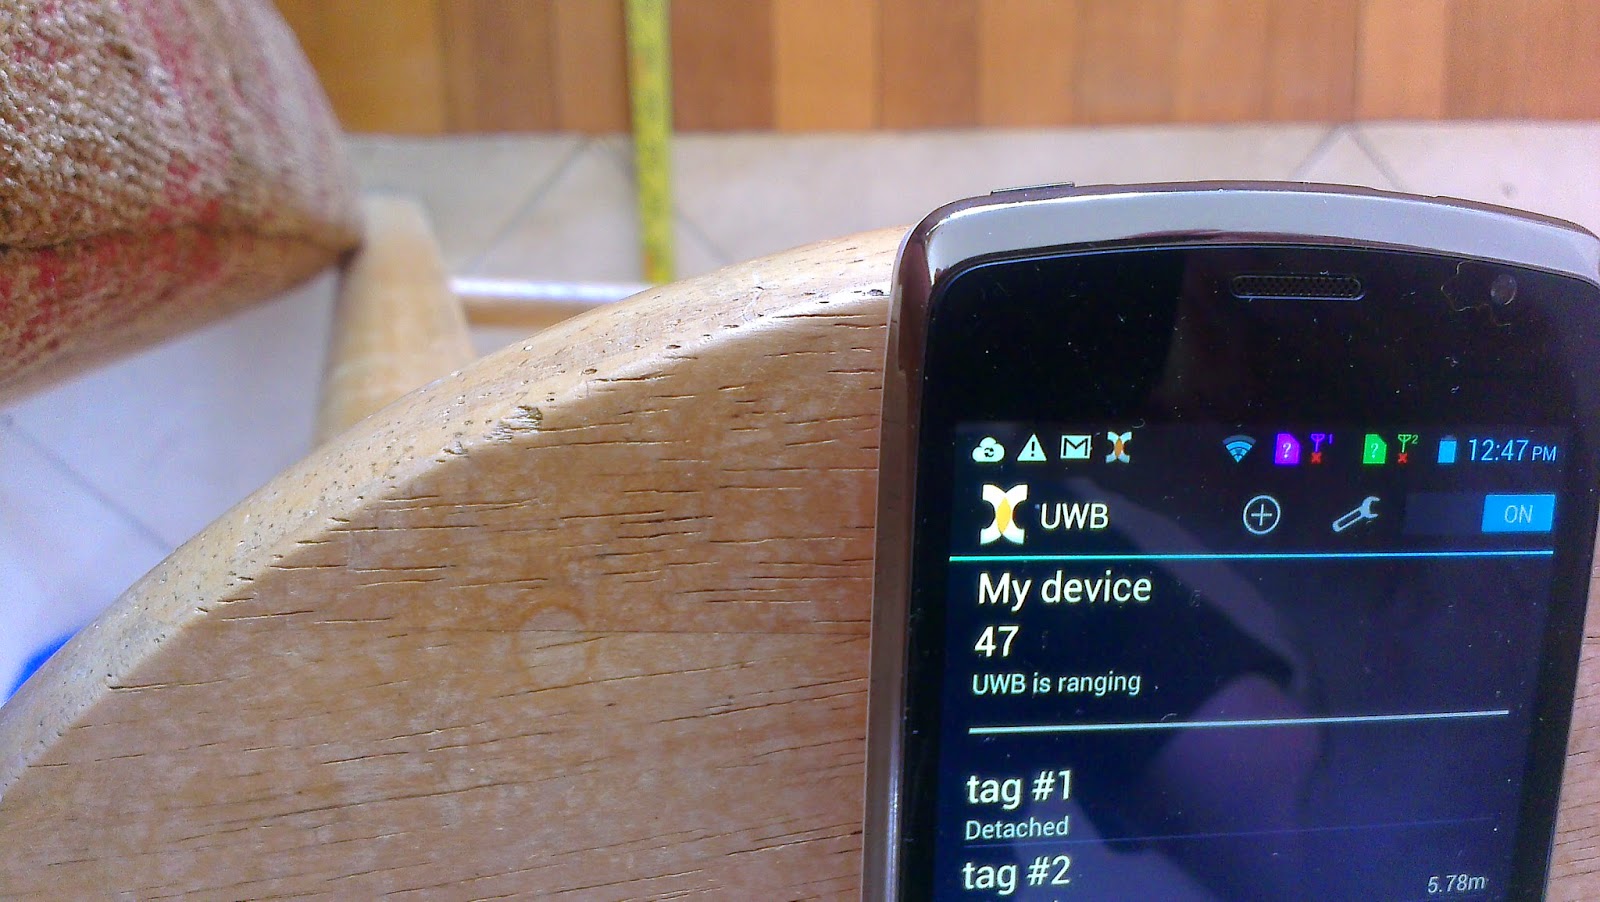
I set the phone on the wooden stool and moved it back to be exactly over the meter mark on the steel ruler.  I used the UWB-logger program to capture the data.  Because the UWB program doesn’t provide any feedback, I monitored ranges on the main system UWB panel.  
I wasn’t sure if the tag would go to sleep if it wasn’t moving for a while.  To make sure that it was awake I walked back and gave it a tap to make sure.

Here’s a detail from the transition from 1 to 2 meters.

I assume the knee in the curve is the range changing as I move the phone.   I need to find some way to figure out how long it takes for the phone to get stable data.   The obvious thing is to turn off the tag, but the UWB Logger program crahes when it loses the tag.

David writes:

It looks like there is a gradually increasing error at meter marks that snaps into position at 6 meters.


This must be random. Right?
Are you logging all range results and walking the tag in meter increments along the tape?
Thanks for doing all the grunt work. Sorry I can’t be there to help.

Mik responds

Answers: 
I don’t think is is as systematic as that.   I suspect experimental error.  I think I need to write my own software for the phone to do this right. 
 

Yes, I was logging all values as I walked the phone along the tape.  The UWB logger is so cumbersome that I thought it was easier to capture the whole data set.  I thought the data would be more obvious to interpret than it is.  I also have the accelerometer data for the phone that shows when the phone was stationary.
The measurement process should be improved as follows:
  1. Exactly establish the distance, accurate to the millimeter.
  2. Leave the tag on all the time.
  3. Use wooden stools to get the tag and phone as much into free-space as possible (no metal within at least a meter)
  4. Leave phone and tag off until ready to take measurement.  Then turn them on, and take a sequence of N measurements. 
  5. Rotate and flip the phone and repeat. (to see if the antenna is seriously polarized).
  6. Rotate and flip the tag for similar reasons.

Choosing N correctly will be important because if N is too large then our power budgets are trashed.  N has to be just large enough to allow the ranger to stabilize, and for samples to converge.

I don’t think it is possible to do the experiment above without having hardware that can be turned on/off with BLE.
Also, I’m not sure what we would learn in practice.
I sent you some log data just before I went to bed last night.   Here’s a fragment:

s=gyr,x=-0.14690529,y=-0.028577317,z=0.09692149,ts=1424988205037,acy=3
s=mag,x=-172.73999,y=-170.28,z=-164.09999,ts=1424988205041,acy=3
s=gyr,x=-0.13305685,y=-0.030707845,z=0.09798675,ts=1424988205042,acy=3
s=uwb,t=tag #1,tu=87289750000000,ts=1424988205044,d=1.3906851,acy=0
s=gyr,x=-0.116012625,y=-0.032838374,z=0.09798675,ts=1424988205045,acy=3
s=gyr,x=-0.100033656,y=-0.03390364,z=0.10011728,ts=1424988205049,acy=3
s=mag,x=-172.68,y=-170.34,z=-164.04,ts=1424988205052,acy=3
s=gyr,x=-0.085119955,y=-0.03390364,z=0.10011728,ts=1424988205054,acy=3
s=acc,x=-0.61291564,y=6.895301,z=7.967903,ts=1424988205055,acy=0
s=gyr,x=-0.07127152,y=-0.03390364,z=0.10011728,ts=1424988205059,acy=3
s=gyr,x=-0.05529255,y=-0.03177311,z=0.09798675,ts=1424988205064,acy=3
s=prs,p=949.69,ts=1424988205065,acy=0

It seems clear that it contains all the components to build an IMU, plus a pressure sensor.  I’ll have a look around for documentation, but it seems mostly obvious.  Here’s my parsing:

record         ::= “s=” <sensorRecord> ” <newline>           // one sensor record per line
sensorRecord   ::= <accRecord> | <gyrRecord> | <magRecord> | 
                           <prsRecord> | <uwbRecord>         // five different sensor record types
timestamp      ::= “ts=” <unixTime>                          // milliseconds since 1/1/1970
accInd         ::= “acy=” (“0” | “3”)

accRecord      ::= “acc,” <xVal> “,” <yVal> “,” <zVal> 
                         “,” <timestamp> “,” <acInd>         // x,y,z, timestamp, accuracy?
gyrRecord      ::= “gyr,” <xVal> “,” <yVal> “,” <zVal> 
                         “,” <timestamp> “,” <acInd>
magRecord      ::= “acc,” <xVal> “,” <yVal> “,” <zVal> 
                          “,” <timestamp> “,” <acInd>
prsRecord      ::= “prs,” <pVal>  
                          “,” <timestamp> “,” <acInd>        // mbar, timestamp, accuracy
uwbRecord      ::= “uwb,” <tagId> “,” <tuVal> “,” <timestamp> 
                     “,d=” <range> “,” <accInd>              // tagName, tuVal? ts, meters, accuracy
tuVal          ::= <64-bit? cardinal>                        // quality assessment?
range          ::= <10.7 floatingPoint>                      // distance in meters

I think accInd may represent the sensor sensitivity (maxG for example).
The tuVal number is a mystery, but I’m wondering if it is some representation of the impulse signal that reveals the quality of the range assessment.

The positional accuracy on the BeSpoon didn’t seem so hot.

For our proposed app, where we are looking for patterns, exact location isn’t so critical as repeat-ability.   In other words, even if the data is wrong, if it is wrong the same way each time then we might be able to notice patterns.

I need to find some easy, and obvious representation of the accuracy and repeatably.   It’s a conundrum because really I want to show the range accuracy between ever pair of points in the apartment.  Even if I just constrained it to 10×10 points that still requires (10×10) * (10×10) measurements.  And for each pair of points I need to gather a bunch of samples, and calculate the mean and SD so I can get some feel for the measured location, and the spread.  <μ, σ>.  That’s well beyond my patience

Can I get a feel for the behavior of BeSpoon with just a few samples?

What I did

I picked a point for an anchor.  In the first case I put it atop a picture in my office.   Then I went to six different “settling places” and took a sample.   I worried that in real life I’d settle in a slightly different way each time, and that could be critical to the measurements.  So in fact I did six laps of all of the settling places, sitting down in a slightly different way each time.  

  1. My office chair
  2. The chair by Brenda’s desk
  3. The dining table where I stand  and stare out the bay window
  4. My favorite location on the settee
  5. A spot just by the cupboard in the kitchen
  6. The hallway lavatory – I actually sat on it each time.

Plotting the results was a real pain, and the diagramming isn’t that great.


Notation

The yellow triangle marks the location of the anchor.
The crosshatched areas are where I couldn’t get enough signal to range.
The samples sets are represent by a row of red lines, all of which are assumed to cross the invisible line radiating out from the anchor.
In each data set the blue cross represents the actual location where the samples were taken
The red lines represent each of the six samples.

Conclusion

Not many yet.  I need to gather a little more data I think.

  1. There is a clear tendency to over-estimate when the signal goes through a wall.
  2. The estimates do tend to cluster within about a 1 meter area

————–
David wrote

    Why *wouldn’t* it be repeatable? If it’s not repeatable then you ought to see a lot of jitter (variation in subsequent continuous measurements) while standing at the same spot. If it’s different 5 minutes later, what else has changed? Could there be an environmental factor (nearby cell phone, Wifi density)?  Why is there a single outlier in 3 or 4 locations?

    For your 100 x 100 sample size, you have to multiply that by the number of antenna orientations (16 or 32, but actually infinite) or 1,600,000, 3,200,000, infinity. It might be worthwhile to take one interesting measurement (I think I would choose Breda’s desk chair, but that means you would have to do a lot of walking) and put the tag in each of the 16 on-axis positions and maybe a few diagonal positions, to see the difference. This should probably wait until I could be there to help.
    Mik responds
    I didn’t explain myself well.  I did just track the jitter initially.  Just sitting still produced a fair amount of jitter – around +/- 3 feet on average I think.   I was keen to get a feel for how well we might discriminate between settling places.  If the ranger were perfectly accurate then what kind of positional variation might you expect…  1-2′ perhaps, allowing for small changes in position of a chair, or your pose in it?

    So muddled thinking ensued… I wanted to see if sitting down in a chair in the same place repeatedly might increase the jitter in reported position.  Maybe it did, but it seemed not to add to the overall jitter much if anything.
    If you look at my data it’s pretty obvious that those settling areas are distinct.   Put another way, I’d say that as long as settling areas are 4′ apart then we should be able to distinguish them.  Of course, we also have other parameters like heading, and altitude to aid disambiguation — not to mention all the other sensor data we could gather too.
    One thing that concerns me, is that I don’t actually understand what the ranger is doing.  One of the tools swaps between display the range in green, or in red.  Maybe there is some “confidence” data that I’m not picking up.
    Also, it isn’t clear what math is going on.  It looks like it is reporting some kind of average of many samples, because the range tends to home in on the final answer.  Not knowing how many smaples it has required to generate the range is a pretty important hole in my understanding.

    Continued…

    Today, I took some measurements from another point with a view to seeing how consistent the measurements were.  This was more interesting.
    I made the second set of measurements by putting the anchor in a location that I know is very poor – the bathroom.  When the anchor was in my office, the bathroom, and bedroom were black holes.  When I placed the anchor in the bathroom, my office and part of Brenda’s office area were black holes.  Makes sense!
    I took the same half-dozen measurements at a sequence of settling points.  As before, when I managed to get range data it jittered over about 4 feet. I chose a point that was in range of both anchors and drew donuts to illustrate the limits of the range jitter.   
    The donut intersection was clearly not where the readings were taken, and the distance from X to the center of the donut intersection was almost exactly five feet.
    I was interested to know roughly how many anchors I might need.  From the following diagram it looks like 4/5 carefully positioned anchors might do the trick.

    Revised conclusions

    1. If we used this kind of data to trilaterate a position then it looks like we could have errors of about +/- 5 feet, and when standing on the cross in the kitchen you would appear to standing about 5 feet away — actually on the kitchen counter.  
    2. But the donut intersection area is actually quite small: about 2 sq ft.  The apartment is about 1500 sq ft, so we ought to be able to recognize a few hundred different settling points.
    3. One anchor covers about 2/3 of the area of the apartment.
    4. Battery life flagged after a couple of hours.


      <Pictures David took of the insides of the tag>


      David writes:
      No-go. The uC in the tag is a Silicon Labs C8051F93x.

      The C8051F93x-C8051F92x family utilizes Silicon Labs’ proprietary CIP-51 microcontroller core. The CIP-
      51 is fully compatible with the MCS-51™ instruction set; standard 803x/805x assemblers and compilers 
      can be used to develop software. The CIP-51 core offers all the peripherals included with a standard 8052.
      I don’t think you’ll be pushing any Cortex M0 code into it, right?
      I dragged out my hot air equipment this morning and removed the lid from a BS module. Photo attached.
      Marking on the module uC is 
      F072CBY
      A30019U
      TW44OY
      This matches with the documents in the SDK release 1.3: RM0091
      Reference manual
      STM32F0x1/STM32F0x2/STM32F0x8
      advanced ARM-based 32-bit MCUs

      I did a few rough and ready tests around the house.  


      It feels like the coverage is roughly the same as the Nanotron.  I can get from the very back of my office almost to the bedroom area window, a distance on 16m, but it’s a bit spasmodic.  It actually poops out at about 16.53 meters, reporting 16.8 m.  I’d call that respectable.

      Unfortunately it was downhill from there.  

      The bathroom was a black hole with the anchors in the positions I show on this diagram.   Nada!

      This diagram is a bit small, but out of 8 ranges on the above test, two had errors in excess of 50″.

      I placed the anchors in two other locations, and tried again, but the results were pretty poor.

      It was getting tedious, and all the mapping from inches to meters was getting me pissed off.  This is not a good start, so I gave up.

      Tomorrow I’ll see if it is repeatable?

      David responds

      Well, that’s disappointing. 


      My initial thought is that it’s about what one would expect. The antennae are small. The Nanotron had a pretty strong output. Remember that were at opposite ends of the street in Los Altos and it was still working well. But inside/outside the house it wouldn’t get past the big rose bush in front. 2.4 GHz propagation ought to be better than 5 GHz.
       

      The DecaWave results were from using the dog ear antenna on the on dev kit. We haven’t tried the chip antenna yet. I’ll bet if we used the dog ear antenna on two BeSpoon units we would get about the same results as the DecaWave, and with two chip antennae DecaWave performance will deteriorate to about what you see with BeSpoon. Perhaps a larger antenna on the anchors is called for, like TS03. 

      It will continue to be a tough challenge. That’s probably why nobody else has come out with a system yet. 

      The comments about the software are more disappointing. I can’t really understand what the weaknesses are since I haven’t looked at it and wouldn’t recognize them even if I did, but I suppose it highlights the difficulty of doing a lot with less resources. At least it works on some level. 

      I never received a response to my email asking about CES from Blinksight. It’s interesting the Guus Frericks, the CMO, doesn’t even mention Blinksight on his CV. However, there are hits for Blinksight on Linkedin so maybe they aren’t completely dead yet. On the other hand when people get laid off they don’t immediately change their LinkedIn profiles.

      Mik Rabbits on…
      I was disappointed too, but it was end of the day.  I am reminded of the f***** homily “every hurdle is an opportunity”, a phrase the gung-ho, ISO-9000, “Quality” acolytes used to roll out.  My old friend David Pendlebury, someone I hope I can introduce you to one day, used to utter the single word “Quality” in the same kind of situations that a lesser soul might say “Bummer”. 

      Anyway, back to the plot… I guess “every hurdle is and opportunity” is kinda correct because if you manage to get over it, then everyone else might have to struggle over it too., and being first to recognize, and define it is an advantage.   But in our game it is easy to miss the path around the side of the hurdle.   
      My old Xeroid colleague Butler Lampson, a man with a very waggely tail, and the ability to think and speak at (for me, intimidating) speed,  and not given to much Cynicism coined the phrase: “insurmountable opportunity”.  Let’s hope this hurdle is worthy, and surmountable.
      I did a bit more thinking and have reduced the invention down to the essence I think.

      I don't think the display part of it is essential actually.  That could be the subject of another patent if we got a suitable display and showed it worked.
      It would be fun to make a prototype using duct tape. It doesn't have to be low-power to test – just small.  It could even have the IMU on a long thin SPI wire inside a chunk of duct tape wrapped around a finger. Maybe someone makes a tiny breakout board already.  I could join it to a microprocessor strapped to my wrist to do first tests.

      //Mik

      On Mon, Feb 23, 2015 at 11:52 AM, David Carkeek <dcarkeek@gmail.com> wrote:

      Bay Area IP Group has three 5-star and one 1-star reviews. The guy who gave one star seems to be at least partially at fault, according to the long response posted by the attorney. However, the attorney wrote "On April 16, 2014 the USPTO mailed their action directly to you at your home: Apt. B, 1737 Sapling Ct., Concord, CA" that seems to show poor judgment, posting the guy's home address in a public forum. Vengeance? 

      Anyway, they seem worth looking into.

      I thought that was the case, but I thought I'd ask in case you recalled anything.  I had heard a rumor that e-ink displays could be cut down, but I don't see how that is possible, and leave the signal matrix in place.

      Obviously there are displays (FitBit) that are pretty small, but I'm guessing they must be custom.  I'm looking for a flexible display that can be wrapped entirely around the outside of a ring.
      Perhaps way off, but it seems like it might be useful.

      //Mik

      On Sun, Feb 22, 2015 at 5:30 PM, David Carkeek <dcarkeek@gmail.com> wrote:

      I make a point of asking About small displays whenever I see displays on display. I haven't seen anything appropriate yet, but I was kind of assuming that one of these display manufacturers in China it would make whatever they were asked to do. I think that e-ink displays can be made almost any size but there are no tiny standard products. You have to pay significant NRE for non-standard sizes. The power supply is only 15V I think. E-ink is compelling if it could be made small enough. Think how cool that would be to have an e-ink display in a ring.

      Sent from my iPhone

      > On Feb 22, 2015, at 12:07 PM, Mik Lamming <mik@lamming.com> wrote:
      >
      > I had a possibly patent-able idea for a display to go into a ring.  Have you seen an eInk display that would fit into ring?   I assume that any other display would not be both flexible, and low-enough power?
      >
      > //Mik