The positional accuracy on the BeSpoon didn’t seem so hot.
For our proposed app, where we are looking for patterns, exact location isn’t so critical as repeat-ability. In other words, even if the data is wrong, if it is wrong the same way each time then we might be able to notice patterns.
I need to find some easy, and obvious representation of the accuracy and repeatably. It’s a conundrum because really I want to show the range accuracy between ever pair of points in the apartment. Even if I just constrained it to 10×10 points that still requires (10×10) * (10×10) measurements. And for each pair of points I need to gather a bunch of samples, and calculate the mean and SD so I can get some feel for the measured location, and the spread. <μ, σ>. That’s well beyond my patience
Can I get a feel for the behavior of BeSpoon with just a few samples?
What I did
I picked a point for an anchor. In the first case I put it atop a picture in my office. Then I went to six different “settling places” and took a sample. I worried that in real life I’d settle in a slightly different way each time, and that could be critical to the measurements. So in fact I did six laps of all of the settling places, sitting down in a slightly different way each time.
- My office chair
- The chair by Brenda’s desk
- The dining table where I stand and stare out the bay window
- My favorite location on the settee
- A spot just by the cupboard in the kitchen
- The hallway lavatory – I actually sat on it each time.
Plotting the results was a real pain, and the diagramming isn’t that great.
Notation
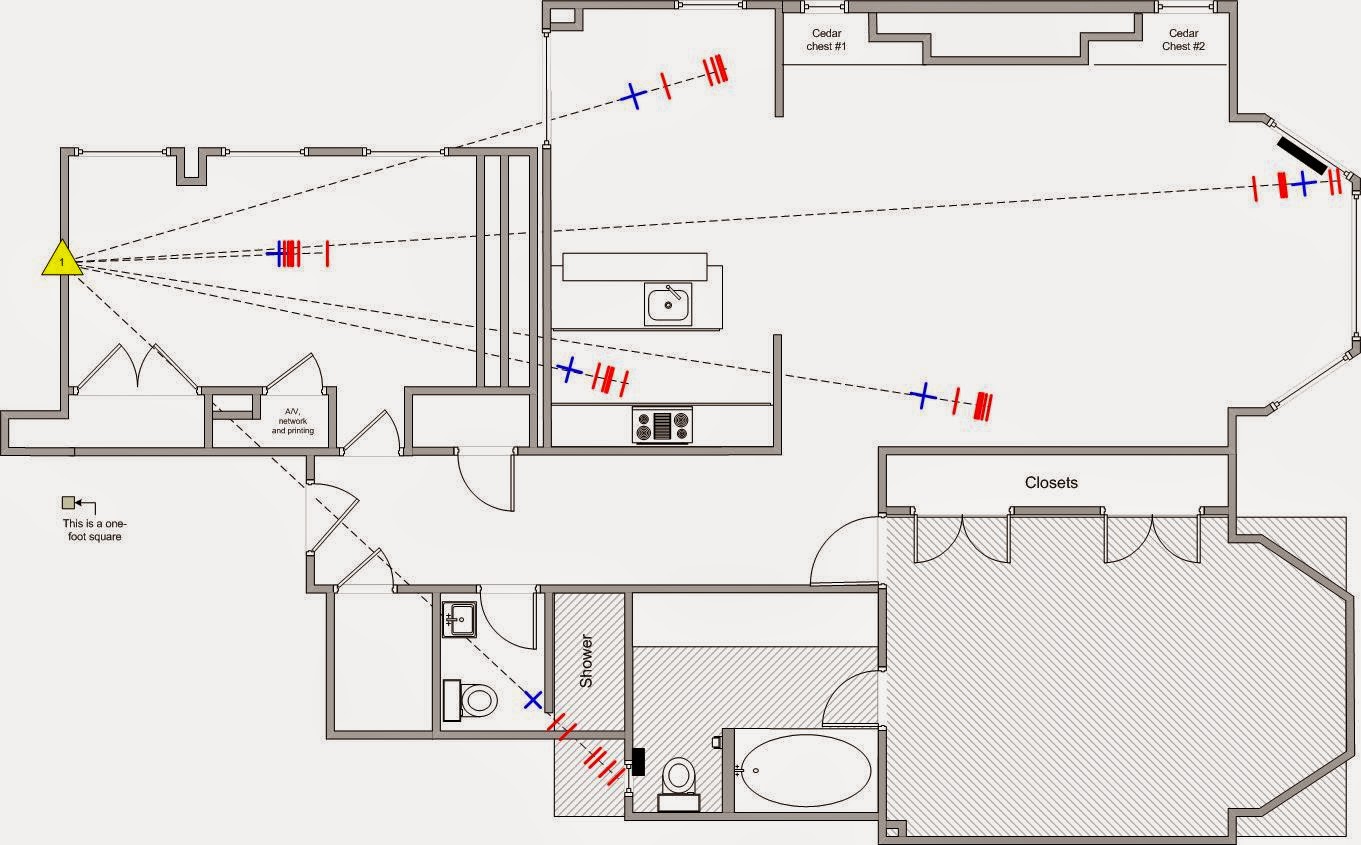
The yellow triangle marks the location of the anchor.
The crosshatched areas are where I couldn’t get enough signal to range.
The samples sets are represent by a row of red lines, all of which are assumed to cross the invisible line radiating out from the anchor.
In each data set the blue cross represents the actual location where the samples were taken
The red lines represent each of the six samples.
Conclusion
Not many yet. I need to gather a little more data I think.
- There is a clear tendency to over-estimate when the signal goes through a wall.
- The estimates do tend to cluster within about a 1 meter area
————–
David wrote
Why *wouldn’t* it be repeatable? If it’s not repeatable then you ought to see a lot of jitter (variation in subsequent continuous measurements) while standing at the same spot. If it’s different 5 minutes later, what else has changed? Could there be an environmental factor (nearby cell phone, Wifi density)? Why is there a single outlier in 3 or 4 locations?
For your 100 x 100 sample size, you have to multiply that by the number of antenna orientations (16 or 32, but actually infinite) or 1,600,000, 3,200,000, infinity. It might be worthwhile to take one interesting measurement (I think I would choose Breda’s desk chair, but that means you would have to do a lot of walking) and put the tag in each of the 16 on-axis positions and maybe a few diagonal positions, to see the difference. This should probably wait until I could be there to help.
Mik responds
I didn’t explain myself well. I did just track the jitter initially. Just sitting still produced a fair amount of jitter – around +/- 3 feet on average I think. I was keen to get a feel for how well we might discriminate between settling places. If the ranger were perfectly accurate then what kind of positional variation might you expect… 1-2′ perhaps, allowing for small changes in position of a chair, or your pose in it?
So muddled thinking ensued… I wanted to see if sitting down in a chair in the same place repeatedly might increase the jitter in reported position. Maybe it did, but it seemed not to add to the overall jitter much if anything.
If you look at my data it’s pretty obvious that those settling areas are distinct. Put another way, I’d say that as long as settling areas are 4′ apart then we should be able to distinguish them. Of course, we also have other parameters like heading, and altitude to aid disambiguation — not to mention all the other sensor data we could gather too.
One thing that concerns me, is that I don’t actually understand what the ranger is doing. One of the tools swaps between display the range in green, or in red. Maybe there is some “confidence” data that I’m not picking up.
Also, it isn’t clear what math is going on. It looks like it is reporting some kind of average of many samples, because the range tends to home in on the final answer. Not knowing how many smaples it has required to generate the range is a pretty important hole in my understanding.
Continued…
Today, I took some measurements from another point with a view to seeing how consistent the measurements were. This was more interesting.
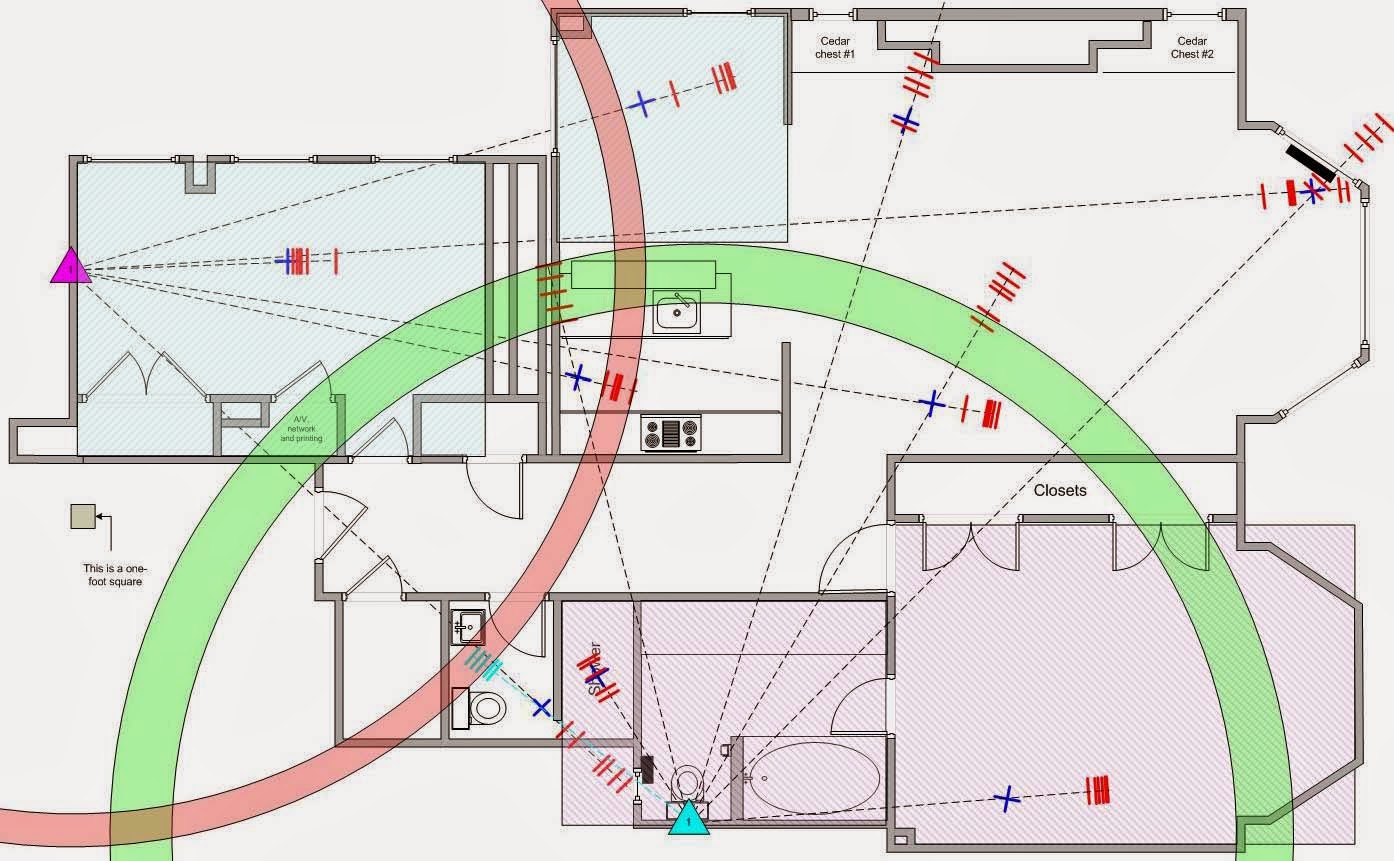
I made the second set of measurements by putting the anchor in a location that I know is very poor – the bathroom. When the anchor was in my office, the bathroom, and bedroom were black holes. When I placed the anchor in the bathroom, my office and part of Brenda’s office area were black holes. Makes sense!
I took the same half-dozen measurements at a sequence of settling points. As before, when I managed to get range data it jittered over about 4 feet. I chose a point that was in range of both anchors and drew donuts to illustrate the limits of the range jitter.
The donut intersection was clearly not where the readings were taken, and the distance from X to the center of the donut intersection was almost exactly five feet.
I was interested to know roughly how many anchors I might need. From the following diagram it looks like 4/5 carefully positioned anchors might do the trick.
Revised conclusions
- If we used this kind of data to trilaterate a position then it looks like we could have errors of about +/- 5 feet, and when standing on the cross in the kitchen you would appear to standing about 5 feet away — actually on the kitchen counter.
- But the donut intersection area is actually quite small: about 2 sq ft. The apartment is about 1500 sq ft, so we ought to be able to recognize a few hundred different settling points.
- One anchor covers about 2/3 of the area of the apartment.
- Battery life flagged after a couple of hours.